Lunar Observations with the Boston University Imaging System
With the same 0.1-meter telescope used for the Jupiter observations, we
image the faint sodium exosphere of the moon. An occulting mask blocks
light from the moon's surface to reduce scattered light in the telescope.
Near full moon, the scattered light overwhelms the faint emission from
the sodium atoms, so we observe near first or third quarters or during
total lunar eclipses.
 |
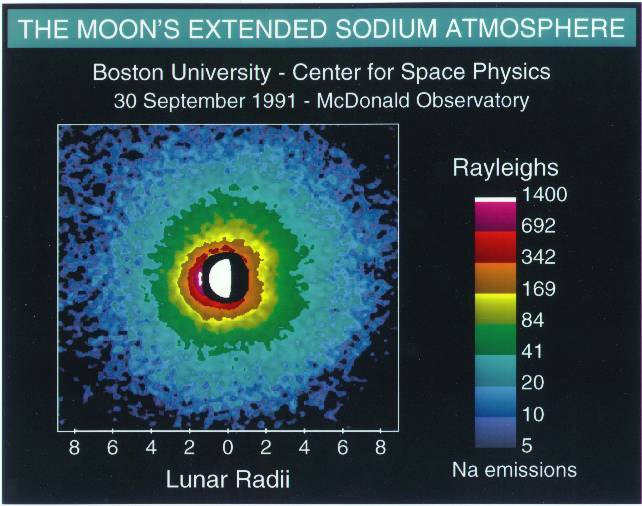
Image of the lunar sodium exosphere 5 days after new Moon. (Mendillo
et
al., Imaging Observations of the Extended Sodium Atmosphere of the
Moon, Geophysical Research Letters, 18, 2097-2100, 1991.) |
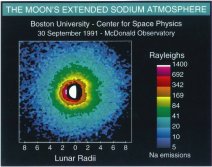 |
Image of the lunar sodium exosphere at third quarter. (Medillo et
al., Imaging Experiments to Detect an Extended Sodium Atmosphere on
the Moon, Adv. Space Res., 13, 10313-10319, 1993.) |
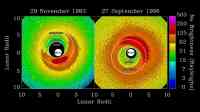 |
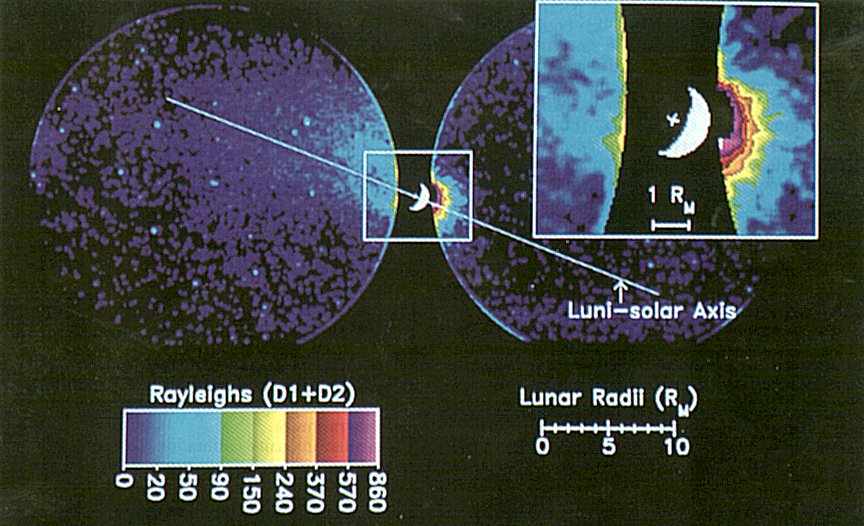
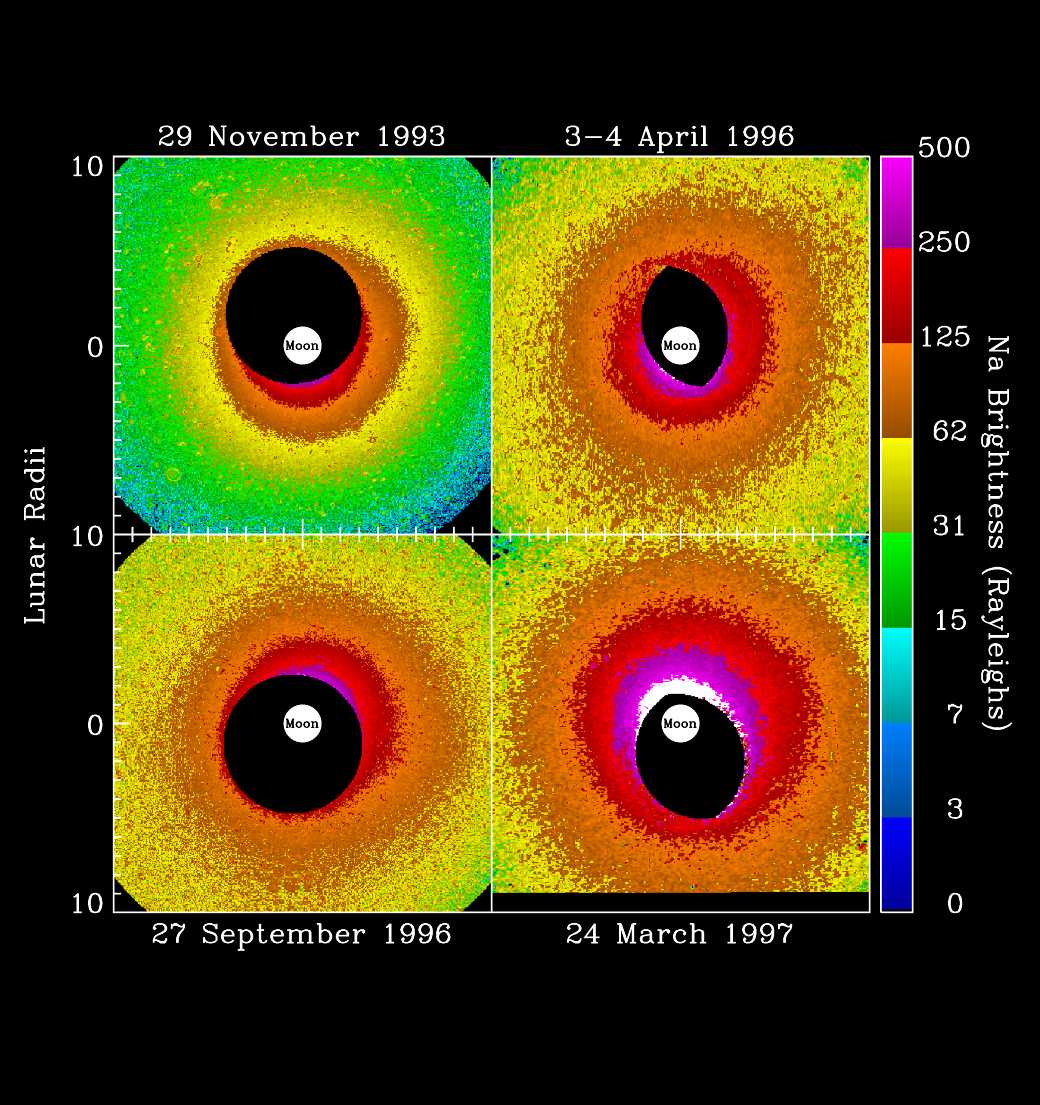
Images of the lunar sodium exosphere during total lunar eclipses. (Mendillo
et
al., Observational Test for the Solar Wind Sputtering Origin of the
Moon's Extended Sodium Atmosphere, Icarus, 137, 12-23, 1999.) |
 |
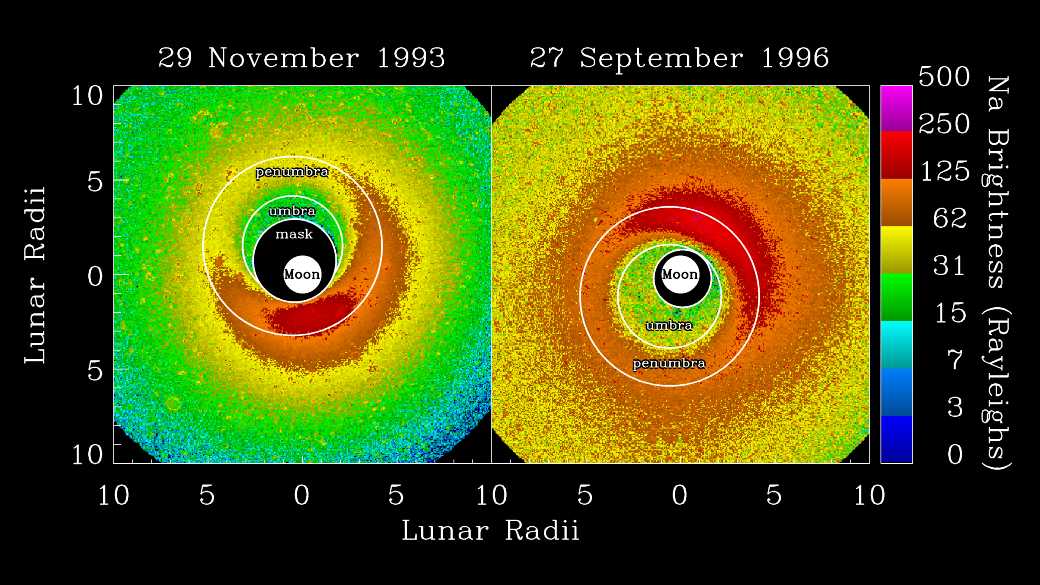
Lunar eclipse images of the sodium exosphere corrected for the penumbral
illumination function. (Mendillo et al., Observational Test for
the Solar Wind Sputtering Origin of the Moon's Extended Sodium Atmosphere,
Icarus,
137, 12-23, 1999.) |
 |
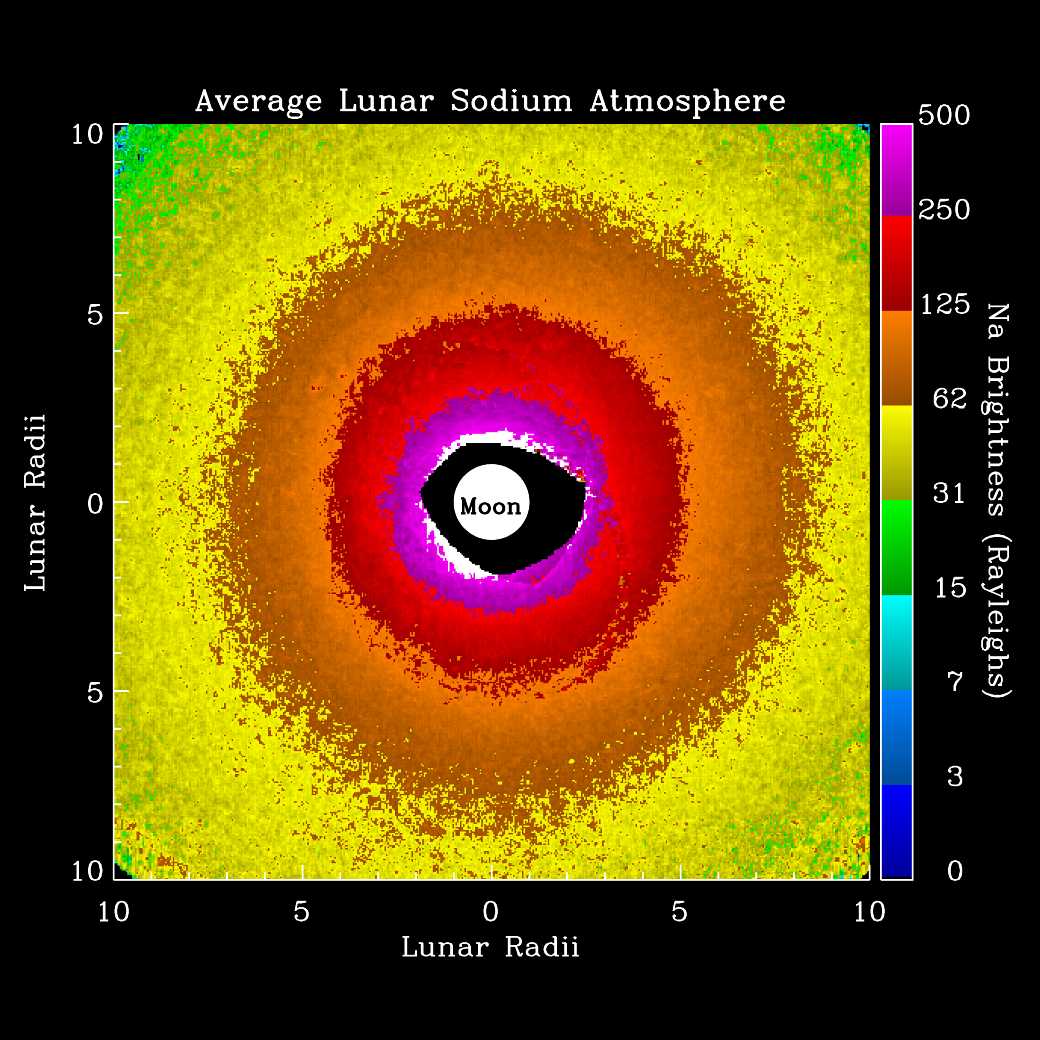
The average lunar sodium exosphere at full Moon. (Mendillo et al.,
Observational Test for the Solar Wind Sputtering Origin of the Moon's Extended
Sodium Atmosphere, Icarus, 137, 12-23, 1999.) |
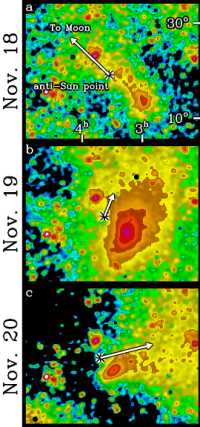 |
Images of the Moon's sodium tail following the 1998 Leonid meteor shower
which peaked on November 17. Please visit our page on the Moon's
sodium tail for more information. |
 |
Top: Image of lunar sodium exosphere during total lunar eclipse of 16 July 2000. The field of
view spans 25ş on a side. The center of the image is covered by the occulting mask (black).
A separate image of the disk of the Moon has been added for scale. Bottom: Image for monoenergetic
model exosphere (without the effect of the Earth’s shadow) for an escape rate of 5 ×10²¹ atoms s-1.
The outer edge of the exosphere delineates the point at which the fastest atoms appear to
“turn around” due to their acceleration away from the Earth via solar radiation pressure. |
 |
Top panel: Comparison of radial profiles for the observed exosphere and the two model exospheres.
The two model profiles are nearly indistinguishable and are good matches to the data. The brightness
values for the data image are derived by dividing the image azimuthally into 8 pie-shaped sectors
centered on the Moon, and averaging all pixels at a given radial distance within each sector. Thus,
while the exospheric brightness decreases with increasing distance from the Moon, there are
proportionately more pixels sampling those dimmer regions, making it possible to distinguish
azimuthally-averaged brightnesses of only a few Rayleighs. Bottom panel: Surface ejection speed
distributions for the two exospheric models. Model A is nearly monoenergetic, while model B resembles
a high-speed tail of a broader distribution. Velocity bins are 0.1 km/s in size.
|