 |
B.U. Imaging Science TeamCenter for Space Physicsat Boston University |
 |
|
B.U. Imaging Science TeamCenter for Space Physicsat Boston University |
|
Press Release |
GRL Articles |
Effect of Earth's Umbra |
Animations |
Press Coverage |
New Data |
Press Release
|
1 June 1999 -- Boston University astronomers announced today the discovery of an enormous tail of sodium gas stretching to great distances from the moon. The observations were made at the McDonald Observatory in Fort Davis, Texas, on nights following the Leonid meteor shower of November 1998. The tail of sodium gas was seen to distances of at least 500,000 miles from the moon, changing its appearance over three consecutive nights... |
|
Caption: Data and model images of the lunar sodium tail on November 19, 1998, the night of new Moon, and two days after the peak of the Leonid meteor shower. Top (Left): All-sky image of sodium (D1+D2) line emission (5896 and 5890 Angstroms) showing an unusual region of brightness near the anti-solar point in the sky; (Right): A close-up view (30x30 degrees) of the emission region, color-coded by brightness in Rayleighs (R). Bottom (Left): Model image of the Moon's sodium tail showing the Earth enveloped by the streaming sodium atoms and focused by the Earth's gravity. Ecliptic north is up and the Sun is to the left; Right: View of the modeled sodium tail as seen from the Earth looking in the anti-sunward direction. |
 |
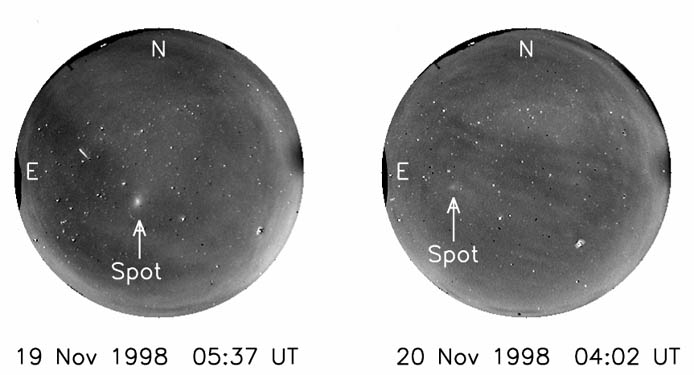
Caption: Simulated image of the lunar sodium tail on November 19, 1998, with and without the effect of the Earth's shadow. The field of view (40 degrees by 30 degrees, centered on the antisunward point) is the same used in Smith et al. and Wilson et al. The leftmost three panels of each row show the contributions from sections at different distances "down-tail," and the right panels show the total observed spot. The umbra has a noticeable effect within 100,000 km, producing a dark spot and reducing the emission throughout the entire field of view. The shadow produces only a small dark spot between 100,000 and 250,000 km and leaves the emission from beyond 250,000 km essentially unaffected. In total, the spot's peak remains at the same location, and its shape is only slightly changed to the east (left) of the peak. |
 |
Data from November 19, 1998 (mpeg). This image sequence shows the entire night sky as seen in sodium light (5893 Angstroms) from McDonald Observatory in Texas. The bright spot is the view of the Moon's sodium tail, looking down its length, at new Moon when the Earth lies inside the tail. The apparent motion of the spot and the stars is due to the Earth's rotation. |
 |
Model of "standard" lunar atmosphere (mpeg) (gif). This is a computer simulation of the Moon's sodium tail showing its motion over a 6 day period. The larger image is the view from north of the Moon's orbital plane, showing the Earth, the Moon, and the sodium tail as seen from "above." The smaller image in the upper right is the view from the Earth, looking down the tail in the anti-sunward direction. Notice how the Earth's gravity bends the tail and "focusses" it briefly around the 19th. |
 |
Model of Leonid-enhanced atmosphere (mpeg) (gif). This shows the same views and time period as the previous movie, but includes only the additional sodium atoms released by the Leonid meteor shower on November 17. Note that the tail as seen from the Earth is brightest early on November 19, the same time shown in the movie of the data. |